
Your Data is in. Now put it to work
Your full history has landed. Here is what it unlocks — predictions you can segment on, richer customer data, and journeys that combine scheduled and real-time in one flow.
Optimove’s predictive models learn from how your customers behave and score each one on what they are likely to do next — how much they will spend, and whether they are about to leave. Built-in reports then show how your business is performing and how it compares to the market.
3 stories
Target customers on what they did and what they bought — Activity History and Purchase History, across their full history — and see exactly how every attribute is defined, calculated and used.
2 stories
Build rich target groups on lifecycle, attributes and full customer history, then run them through journeys that mix scheduled and real-time campaigns.
2 stories
Predict · 01
Future Value — segment on what customers will spend
A machine-learning prediction of the revenue each customer is expected to generate over the next 12 months, so you can identify your most valuable customers, understand what makes them valuable, and allocate marketing spend strategically.
Predict · 02
Risk of Churn — be there before they leave
A daily prediction of how likely each live customer (New, Active, Reactivated) is to churn within the next two periods — so you know when to step in with a win-back offer.
Measure · 01
Reports — explore your customers and your business
Ready-made reports under Analyze give you the full picture without stitching data together. A few to start with:
Enrich · 01
Activity History — target on what they did
Build target groups on what customers did in the recent (or not-so-recent) past, and send offers and incentives that match their behavior.
Enrich · 02
Game/Product and Purchase History — target on what they played and bought
Personalize on the specific games, products and categories customers played or bought in the past — bonuses, cross-sell offers and incentives based on their real patterns.
Segment · 01
Rich segmentation — target groups built on full history
With your historical data now in Optimove, target groups can go far beyond who a customer is today — combine lifecycle, attributes and everything customers did, bought and received in the past.
Orchestrate · 01
Hybrid streams — scheduled and real-time in one journey
Combine triggered and scheduled campaigns in the same stream flow, then test treatments against a control to find the messaging, offer and timing that work.
Predict · 01
Future Value — segment on what customers will spend
A machine-learning prediction of the revenue each customer is expected to generate over the next 12 months, so you can identify your most valuable customers, understand what makes them valuable, and allocate marketing spend strategically.
1Use it in a target group
From Customer Explorer or Target Groups, add the Future Value Prediction criterion and pick one or more categories.
2Five categories
Highest (top 1%), High (next 9%), Medium (next 20%), Low (next 20%) and Lowest (bottom 50%) — each shows its value range next to it.
3Future Value Score
Set your own value threshold — for example, Future Value Score ≥ $80.
4Rank in Future Value
Segment by percentile — Rank = 100 is the top 1%, Rank ≥ 80 the top 20%.
5Rank in LCS of Future Value
The top customers within each lifecycle stage, so the top 1% isn’t made up only of Active customers.
6Put it to work
Reward your future best customers early through loyalty programs, and shift budget toward high-potential customers.
7For example
Select Highest future value in the Customer Explorer and save it as a target group — such as a lookalike seed for paid media, so you acquire more customers like your future best.
Next story 1 of 7
Future Value Prediction categories — each with its value range and customer count
Example — a paid media lookalike seed built from Highest future value customers
Predict · 02
Risk of Churn — be there before they leave
A daily prediction of how likely each live customer (New, Active, Reactivated) is to churn within the next two periods — so you know when to step in with a win-back offer.
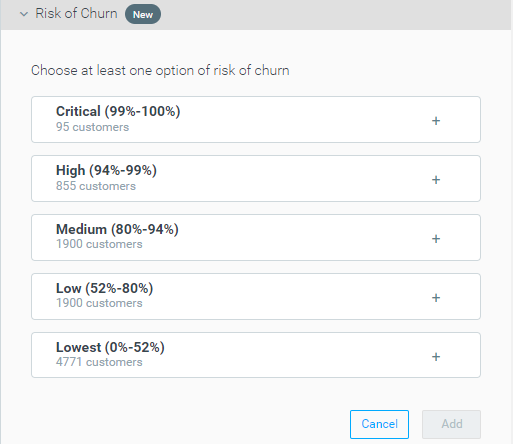
1Five risk levels
Critical, High, Medium, Low and Lowest — percentile groups compared against the rest of your live customers. Select them directly under Risk of Churn.
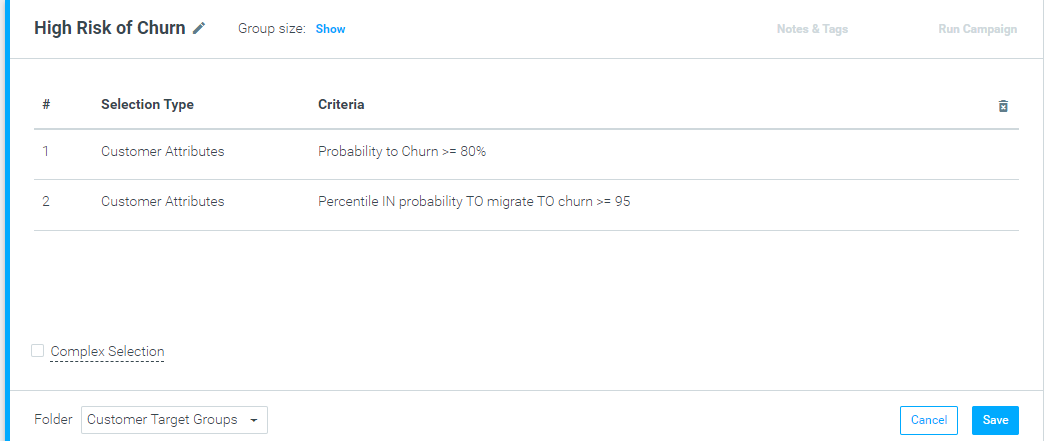
2Set your own threshold
Use Churn Probability Score (e.g. ≥ 0.7), Rank in Churn Probability (e.g. top 5% = ≥ 95), or Rank in LCS of Churn Probability for the top 1% within each lifecycle stage.
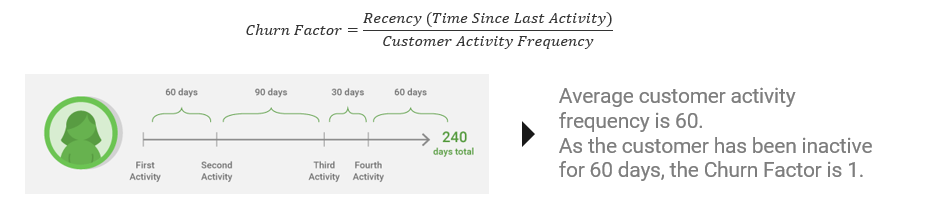
3Add Churn Factor
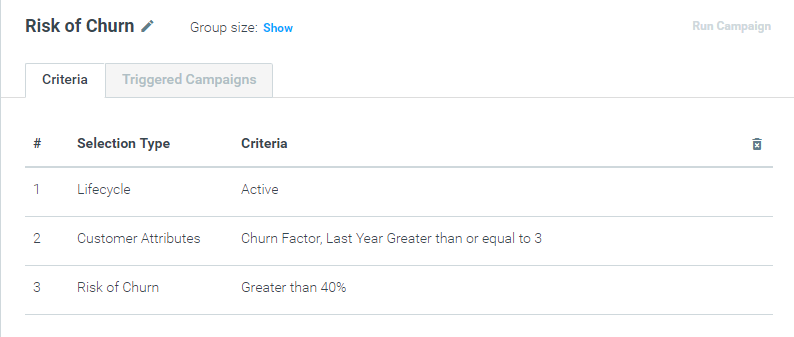
Measures churn against each customer’s own activity frequency — a threshold of 2 to 3 flags anyone at double or triple their usual gap. Combine it with Risk of Churn for the best result.
4Catch the decliners
Because prediction is built on lifetime value, the model also flags still-active customers whose predicted value has dropped sharply.
5Spend where it matters
Scale the offer to the risk instead of sending 10% to everyone, and measure risk by acquisition channel to see which “cheap” channels bring high-risk customers.
6Win-back ideas
A free offer, a high incentive for a real transaction, tiered offers by value, addressing poor experiences, follow-up reminders, and multi-channel reach.
Risk of Churn levels — customers per level and their probability range
Custom threshold — top 5% by Rank in Churn Probability
Churn Factor — churn relative to each customer’s own rhythm
The recommended combination — Churn Factor plus churn prediction
Measure · 01
Reports — explore your customers and your business
Ready-made reports under Analyze give you the full picture without stitching data together. A few to start with:
1Customer Explorer
Explore any customer group’s characteristics and behavior, refine the selection, then save it as a target group. Compare groups side by side and track how customers migrate between them.
2Business Performance Overview
Your KPIs at a glance — trends, top performing days and retention, by year, quarter or month.
3Benchmark Report
Compare your monthly KPIs with similar operators in your geography and vertical, from anonymized, aggregated data (Beta).
4Explore many more reports
These are just a few examples — browse the full set of reports for analyzing your marketing strategies in the Academy.
Customer Explorer — explore a group, then save it as a target group
Business Performance Overview — summary metrics
Benchmark Report — your KPIs next to the market
Enrich · 01
Activity History — target on what they did
Build target groups on what customers did in the recent (or not-so-recent) past, and send offers and incentives that match their behavior.
1Build the criterion
Type of history (with or with no activity), activity type (metric or days with activity), function (Total, Average, Minimum, Maximum), the activity, a condition and a time frame.
2Numeric metric
Select on a value such as number of orders, purchase amount or logins — for example, total net revenue less than minus $300 yesterday.
3Days with activity
Select on how many separate days an activity happened — "at least 5 login days" in a date range.
4No activity
Find customers who had no days with an activity in a period — purchased last Black Friday, but not this one.
5Combine for precision
Pair it with Campaign History to cap how often someone gets the offer, or with a win-ratio threshold for high rollers.
6Update frequency
Activity History updates daily.
7See the whole story of any attribute
In Data Studio, every attribute has a details page: what it is, where its data comes from, how it is calculated (including the SQL), where it is used, and summary statistics of its values. Gradual rollout.
Activity History criterion — players with a daily loss above $300
Attribute details — source, calculation query, value statistics and where it is used
Enrich · 02
Game/Product and Purchase History — target on what they played and bought
Personalize on the specific games, products and categories customers played or bought in the past — bonuses, cross-sell offers and incentives based on their real patterns.
1Three elements
Type of history (with or with no activity), the game, product or category, and a time frame — from a single date to the last calendar year.
2Game/Product History
Select customers who played — for example Casino, Game_Name equals Joker Poker, during the previous 14 days — or who didn’t.
3Purchase History
The same logic for retail: customers who bought — Category equals Accessories, during the previous 14 days — or who didn’t.
4New game launch
Send a generous bonus to players who wagered more than $1,500 on roulette in the past three months — or to active players who haven’t played roulette at all.
5Off-season cross-sell
Combine a Football Fans segment with players who bet on tennis in the past 90 days to keep them betting in the off-season.
6Update frequency
Game/Product and Purchase History update daily.
7See the whole story of any attribute
In Data Studio, every attribute has a details page: what it is, where its data comes from, how it is calculated (including the SQL), where it is used, and summary statistics of its values. Gradual rollout.
Game History — customers who played Joker Poker in the previous 14 days
Purchase History — customers who bought Accessories in the previous 14 days
Attribute details — source, calculation query, value statistics and where it is used
Segment · 01
Rich segmentation — target groups built on full history
With your historical data now in Optimove, target groups can go far beyond who a customer is today — combine lifecycle, attributes and everything customers did, bought and received in the past.
1Where to build
Target Groups under Plan, or Customer Explorer under Explore. Click Add selection to open the Selection Criteria panel.
2Lifecycle and segmentation layers
Start from the customer’s lifecycle stage and behavioral personas — both update daily.
3Customer attributes
Any raw or calculated data point you hold, from country to days since first order.
4Activity and purchase history
What customers did and bought, day by day, over any timeframe — now available across their full history.
5Campaign history
Optimove’s “campaign memory”: who was targeted and who responded — for example, customers under-exposed to campaigns in the last 30 days.
6Layer them together
For example: Lifecycle = New, Days since first order ≤ 2, and targeted with a campaign in the last 10 days.
7Explore before you send
In Customer Explorer, see the group’s metrics, top customers and cohort survival, refine it, then save it as a target group.
A target group combining lifecycle, a customer attribute and campaign history
The same group built from the Customer Explorer
Creating a new target group or folder on the Target Groups page
Orchestrate · 01
Hybrid streams — scheduled and real-time in one journey
Combine triggered and scheduled campaigns in the same stream flow, then test treatments against a control to find the messaging, offer and timing that work.
1Set up the stream
Stream Builder under Execute: pick the objective, name it, set the date range, and split treatments — 90/10 or 80/20 against control.
2Start either way
Kick off with a triggered campaign on a purchase, or a scheduled announcement followed by a same-day trigger.
3Mind the rules
Triggered campaigns must connect to a Trigger Split (Yes) and can't be followed by another campaign on the same day.
4Follow up with splits
Wait, then add an Attribute Split on a calculated attribute such as Number of Purchases, Yesterday.
5Lock in the flow
In Manage Target Groups, give the stream's folder the highest priority so customers receive the full journey.
6Availability
Hybrid streams are in Open Beta and may not be available to every client — check with your CSM.
Previous 7 of 7
Flash sale — scheduled announcement, a visit trigger, then attribute based follow-ups
Happy hour — a scheduled email plus a real-time pop-up during the offer window