
This guide presents the various scenarios available while analyzing customer migrations between two groups during a given period.
The following examples look at customer migrations between two target groups during a one-year period:
- Group 1: Active Risk of Churn
- Group 2: Churn
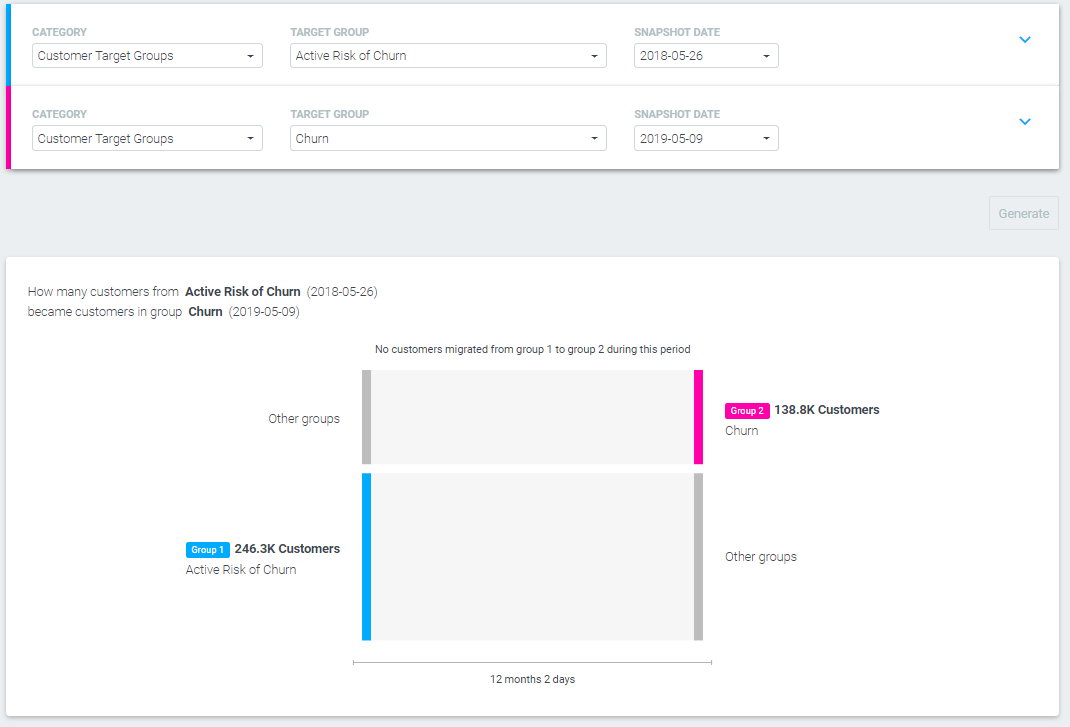
No customers migrated from Group 1 to Group 2 during the selected period.
In this case, all 246,300 customers who were in the Active Risk of Churngroup in May 2018 migrated to other groups by May 2019, but none of them were in the Churn group at this time (and vice versa).
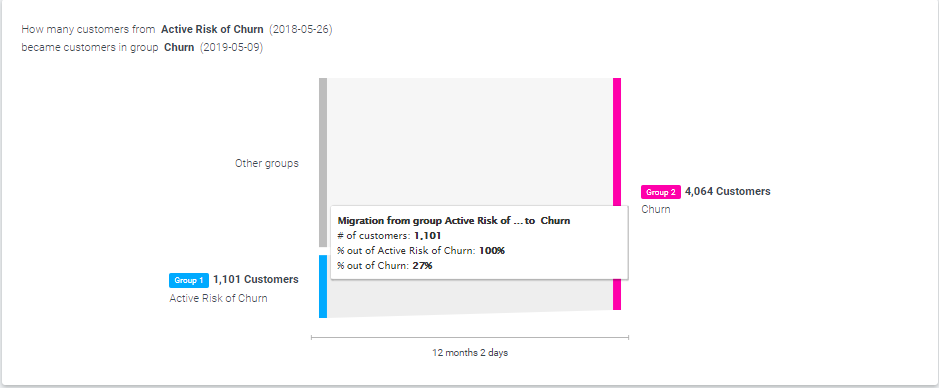
All customers from Group 1 migrated to Group 2 during the selected period.
In this case, all 1,101 customers who were at the Active Risk of Churn group in May 2018 migrated to the Churn group by May 2019.
These customers represent only 27% of the Churn group at the end of the selected period; the remaining 73% were members of other groups (or no group) a year earlier.
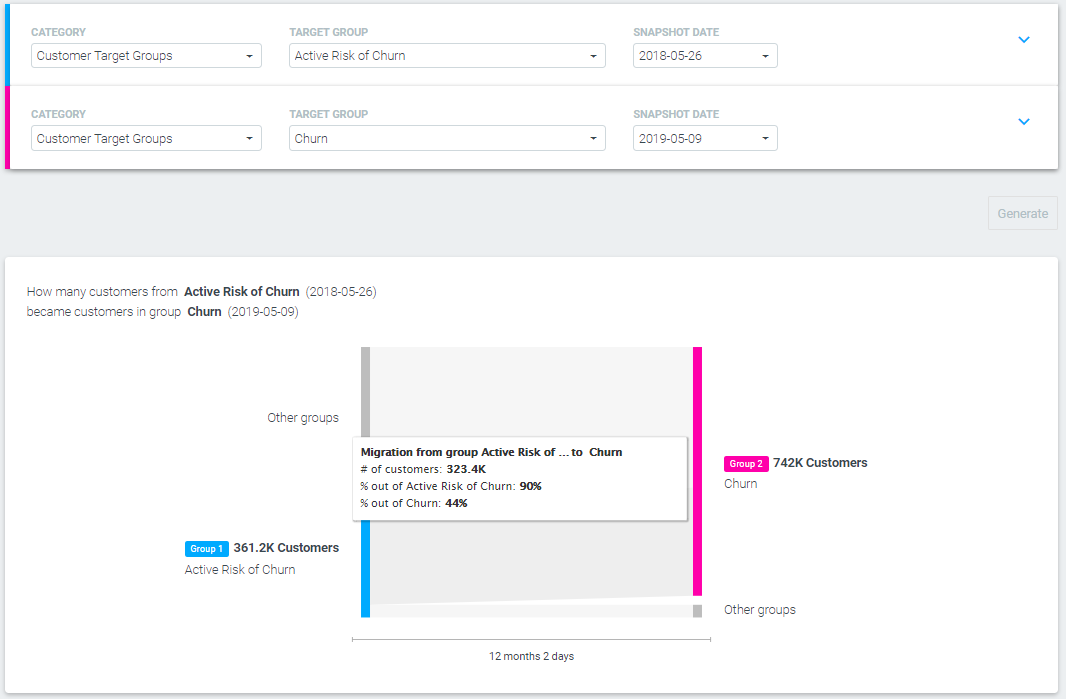
Some customers migrated from Group 1 to Group 2 during the selected period.
In this case, 323,400 customers who were members of the Active Risk of Churngroup in May 2018 were also members of the Churn group a year later, in May 2019.
These customers represent 90% of the entire Active Risk of Churn group(323,400 out of 361,200), while only 44% of the Churn group (323,400 out of 742,000).
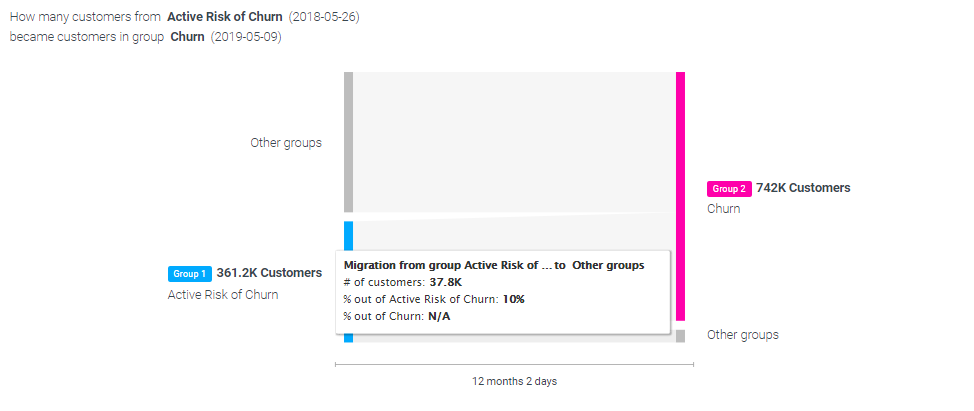
An additional 37,800 customers migrated from Active Risk of Churn to other groups.
No customers were in Group 2 at the end of the selected period.
In this case, there were no customers in the Churn group in May 2019. Therefore, only the first group is visible in the Sankey diagram.
This means that none of the 18,100 customers who were members of the Active Risk of Churn group in May 2018 were members of the Churn a group one year later.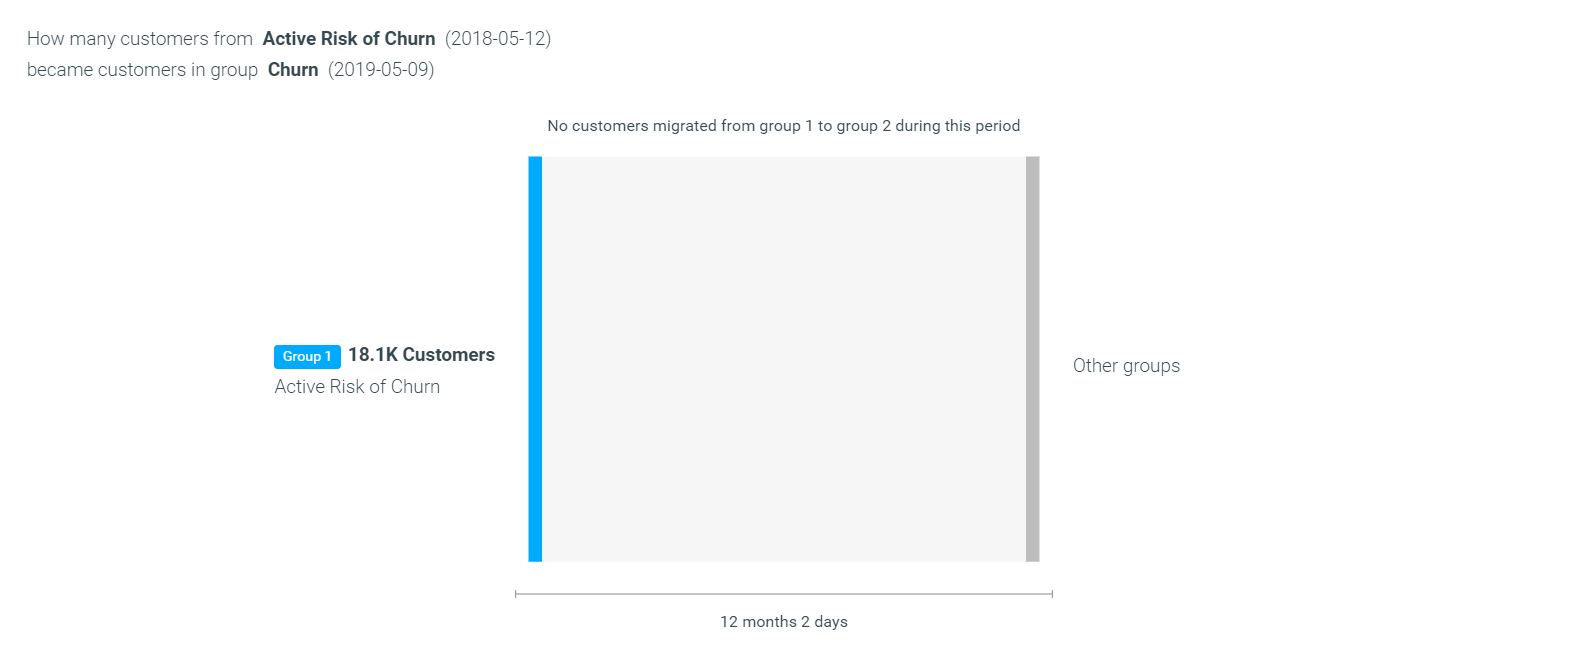
FAQ
What does the Group Migration tab do?
The Group Migration tab helps you track customer movements between different groups over time. For example, you can monitor the reactivation rates of customers who migrated from a Churn group to a Reactivated group over a specific period.
How do stable group memberships reflect on your engagement strategy?
Stability within a group suggests effective engagement, as customers are neither churning nor migrating to other groups. This can be a positive sign of customer satisfaction and loyalty.
What does a significant drop in a group’s size indicate?
A shrinking group size could indicate issues such as customer dissatisfaction, increased competition, or ineffective engagement strategies, necessitating a review and adjustment of marketing tactics.
How can migration patterns guide retention strategies?
Analyzing these patterns can help identify at-risk customers early, allowing for targeted retention strategies to reduce churn and improve customer lifetime value.
What does it suggest if a group has no members left after a period?
This could imply that all customers either moved to other groups or were retained, resulting in the elimination of that group. Such as successful retention efforts or a natural decline of a particular customer segment.
What can I learn if only some customers migrate between groups?
This is a partial movement, which may indicate that while some customers are transitioning, others are either stabilizing or moving to different groups. It can provide insights into which factors may be influencing customer behavior.
What does it mean if all customers from one group migrate to another group over time?
This suggests a complete transition of customers from one group to another, indicating a significant change in customer behavior or status, such as all at-risk customers churning.
What does it mean if no customers migrate between two groups during a given period?
It indicates that the customers in each group either moved to other groups or remained in their original group, but there was no direct migration between the two groups.