The Business Performance Overview report was created to eliminate the need for multiple steps when analyzing your data, providing you with a full glance at your KPIs and metrics.
Report Overview
The report is located under the Analyze tab on the main navigation bar.
The top section of the report allows you to set the time frame and date range.
Select a Yearly, Quarterly, or Monthly view, and then choose the starting point.
You can also customize the report by analyzing your business performance against a range of KPIs, as well as filter your data by lifecycle stage.
You will then be introduced to a summary of your metrics:
- Total deposit/order amount
- Unique depositors/customers
- Average deposit/purchase amount per depositor/customer
Keep in mind that the numbers will change according to the report’s time settings above
Data Visualization
Each of the KPIs in the summary is presented in a graph to help you identify trends and gather new insights.
To better visualize your data, some of the graphs allow you to select whether you would like to group your data daily, weekly, or monthly.
Total deposit amount
Unique customers
Average deposit amount per customer
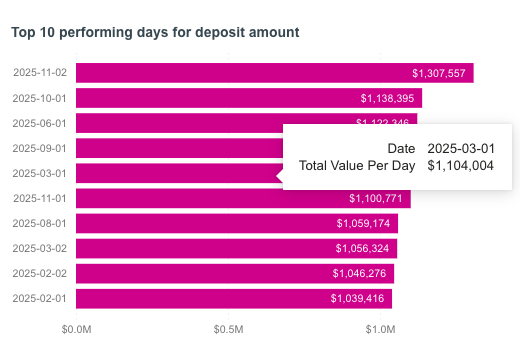
Top Performing Days
Get insight into the specific days your business performed the best for your chosen KPI within your chosen timeframe.
You can hover over each bar to view the total order amount (or any other KPI) for each day.
Use this insight to look back at your marketing plan around these dates and analyze how it benefitted your business, for example to measure the success of last year's holiday campaign.
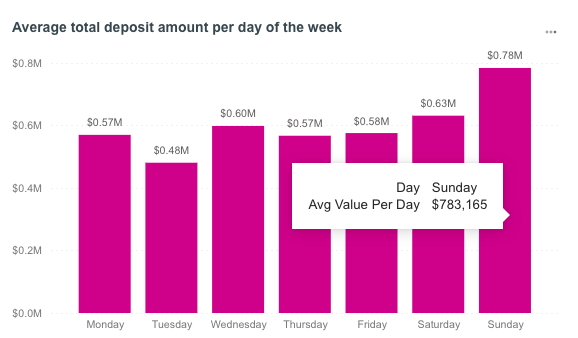
Weekday Analysis
Calculate the average total order amount (or any other KPI) for each day of the week within your chosen timeframe.
By tracking trends in customer spend during the week, you can effectively plan when to execute future campaigns and maximize their impact.
Retention
The retention report shows the current customers, divided into First Time Depositors and Existing Depositors.
You can set the report to provide a monthly or weekly breakdown.
FAQs
What metrics are presented in the Business Performance Overview report?
The report presents the total amount of deposits, the total number of unique depositors, and the average deposit amount per depositor.
Is it possible to customize the Business Performance Overview report?
Unfortunately, at this time, the report is not customizable and will only provide the metrics and KPIs mentioned above.
How often does the Business Performance Overview report update?
The report is updated daily as part of the batch data process.
