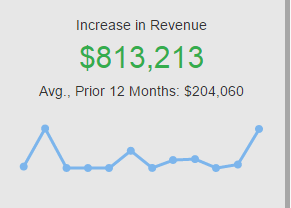
Video Transcript
What is an Increase in/Uplift?
-
Revenue is the actual money received from a customer in a given time period.
-
Upliftlso known as Incrementality, is a statistical quantity measuring the additional money spent by the customer due to a specific campaign. In other words, it explains the monetary difference resulting from sending or not sending a given campaign to a specific target group.
Measuring uplift
- Customers that received only A
- Customers that received only B
- Customers that received A & B
- Response Rate: the number of customers that contributed to the uplift metric out of the total number of customers in the group (e.g., those customers who made a transaction at any time during the measurement period)
- Average Value: the average contribution to the uplift metric by customers in the group (e.g., average order value of all customers in the group who placed an order during the measurement period)
What is an Increase in/Uplift?

Interpreting Uplift and Attribution
- Green indicates that the test group outperformed the control group in the analyzed KPI and the difference in performance was statistically credible.
- Gray indicates that the result was not statistically credible, regardless of whether the test group outperformed the control group or not. This means the campaign had no attributable uplift to the measured KPI.
- The Birthday campaign shows an average uplift per customer of $5
- The Newsletter campaign shows an average uplift per customer of $10
The question is – how much money of the overall $100 can be attributed to each campaign?
Here’s the answer: $5 can be attributed to the Birthday campaign, $10 can be attributed to the Newsletter campaign, and the rest can be attributed to spontaneous behavior irrespective of any campaigns. Why? The $5 uplift from the Birthday campaign means that having been targeted with the Birthday campaign made Jane spend $5 more than what she would have spent otherwise, had she not been targeted with the Birthday campaign. This is regardless of any other campaigns she was exposed to (e.g., the Newsletter campaign).
The fact is that there is an equivalent and representative control group for each campaign. As explained by the diagram below, for each customer who received the Birthday campaign and also the Newsletter campaign (labeled “Both”), there is an equivalent customer who did not receive the Birthday campaign but did receive the Newsletter campaign (labeled “Newsletter Only”). This helps balance the effect of the Newsletter campaign on both groups and allows for a clean isolation of the unique and marginal impact of the Birthday campaign. The same is true for the uplift calculated for the Newsletter campaign.
So overall, on average, for a customer such as Jane Doe, $5 can be attributed to the Birthday campaign, $10 can be attributed to the Newsletter campaign, and the remaining $85 she spent (of a total of $100) can be attributed to spontaneous spending behavior that can be expected by customers who were not targeted with campaign A or B.
Reports
Where can I see the “Increase In” metric?
As mentioned above the metric can be viewed on the campaign analysis page. Additionally, it can be viewed on the Campaign Analysis Page, in Mission Control, and in the Marketing Plan Explorer.
Campaign Analysis Page
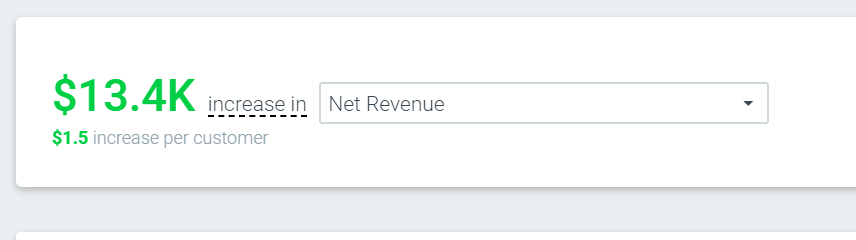
At the top of the Campaign Analysis page, there is a summary “Increase in” figure which you can toggle for any KPI. This increase in the figure displays the value for a single occurrence or a series analysis depending on your selection. For more on Campaign Analysis click here.
Mission Control
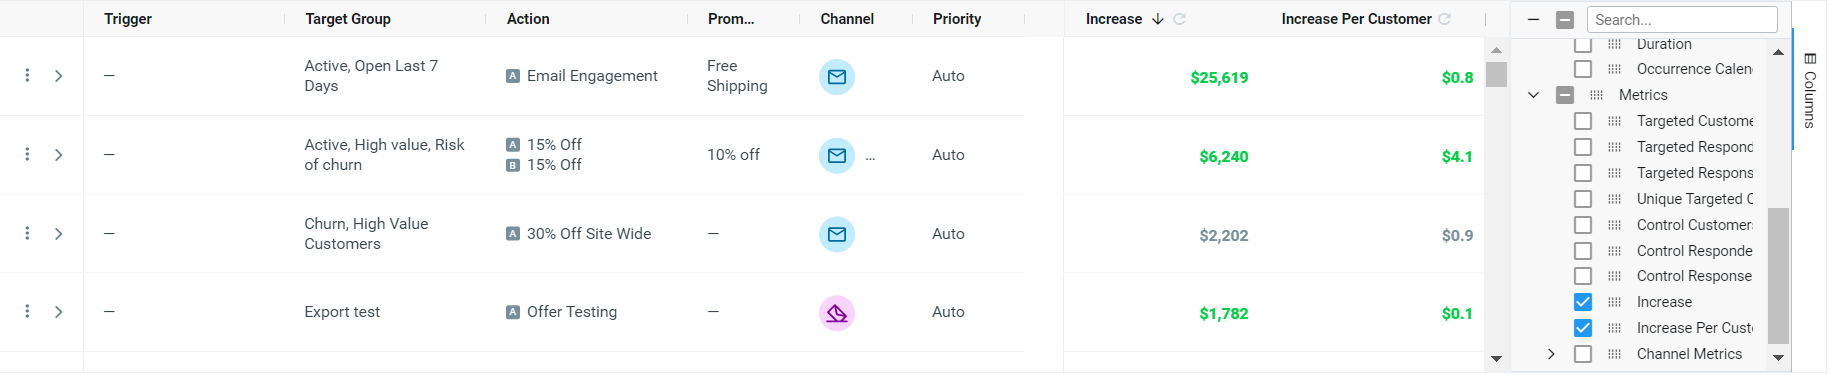
In the Mission Control dashboard, there is a summary “Increase in” figure that aggregates the “Increase in” figures for all the campaigns that match your chosen KPI. Only statistically credible uplift results are included in this summary metric.

Why can’t the Mission Control performance summary give a figure which takes into account all KPI increases and decreases, and not just the statistically credible ones?
If a result is not statistically credible, then that result may be due to nothing other than chance – it tells you little or nothing and can be misleading. Including such results may lead you to make decisions based on random chance, rather than on the actual performance of their campaigns, a situation that would likely lead to sub-optimal performance of your overall marketing plan.
Marketing Plan Explorer
The “Increase in” metric presented in the Marketing Plan Explorer is the sum of the uplift results for all the campaigns run during the currently displayed period (week or month).