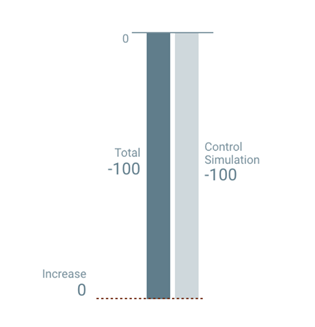
- Total - The total revenues generated by the campaign are represented by the combined results of the test group and the control group.
- Control Simulation - The revenues that would have been expected in the absence of any campaign (represented by the behavior of the control group).
Example Results
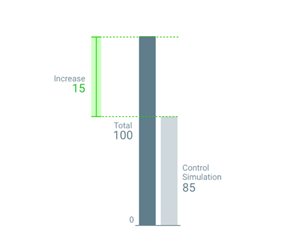
The test group is leading. The increase is positive.
The total revenue from the campaign in the measured period was $100, while the control simulation only generated $85. As a result, the increase generated by this campaign is +15.
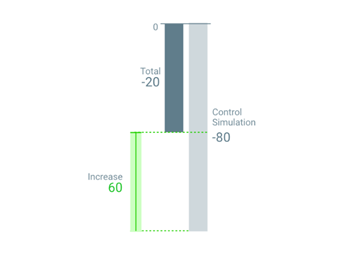
Both test and control groups have a negative impact. The increase is positive.
Let’s assume both groups resulted in a negative impact on revenue. Since the total led to -$20 while the control simulation led to -$80, the increase generated by the campaign is +60.
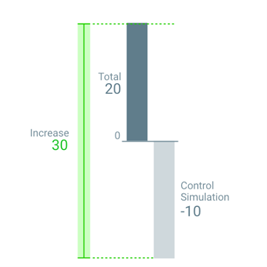
The test group has a positive impact while the control group has a negative impact. The increased figure is positive.
The total revenue from the campaign in the measured period was $20, while the control simulation resulted in a negative $10. As a result, the increase generated by the campaign is +30.
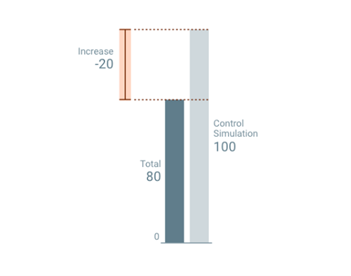
The control group is winning, Increase value is negative.
Here, the control simulation’s revenue from the campaign in the measured period was $100, while the total revenue was $80, meaning the control simulation performed better than the total. As a result, there is a negative -20 ”Increase”.
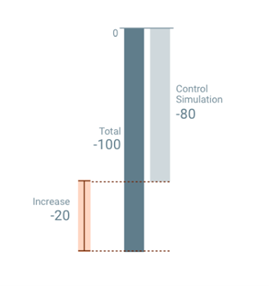
Both test and control groups have a negative impact, but the test group underperforms. The increased value is negative.
In the below example, both had a negative impact on revenue, but the total results are worse than those of the control simulation. Because the total impact was -$100 while the control simulation’s impact was -$80, there is a decrease of -20.
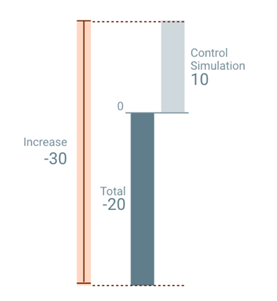
The test group has a negative impact while the control group has a positive impact. The increased value is negative.
In this scenario, the total revenue from the campaign in the measured period was negative while the control simulation had a positive outcome. The total had a -$20 negative impact on revenue and the control simulation impacted revenue positively at +$10. For that reason, there is a decrease of -30.
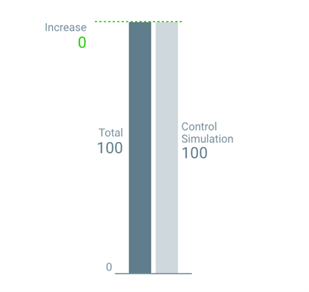
Both the test and control groups have the same positive results.
In situations where both the total revenue from the campaign in the measured period and that from the control simulation are identical, there is 0 increase.
Both the test and control groups have the same negative results.
The 0 increase also applies when both show identical, negative results.