
Optimove provides each customer with a best-in-class customer model, tailor-made to the customer’s unique data set and KPIs.
This article will walk you through the segmentation method behind the Optimove model.
It all starts with a Single Customer View
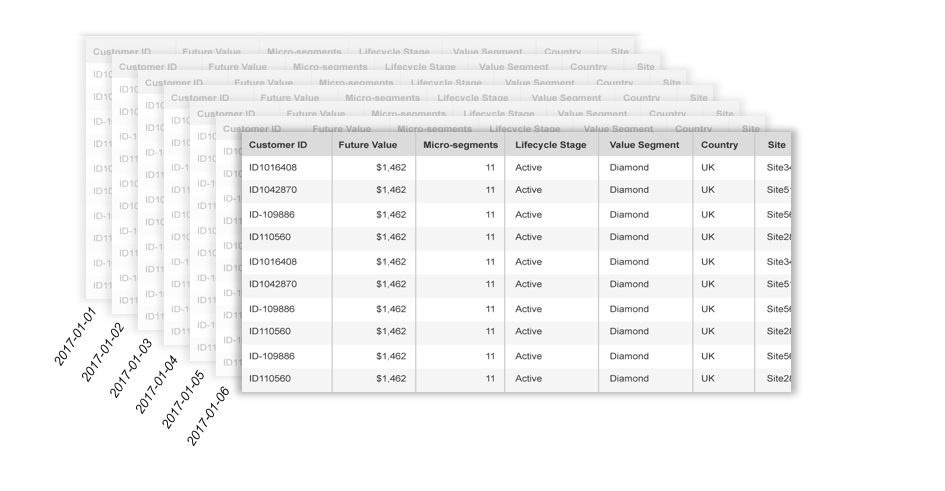
As part of the initial setup, and then on an ongoing basis, Optimove collects all available customer data into a single customer view. A single customer view is a flattened, aggregated, continuously updated table of each customer in the database.
Every row in this table tells the story of a single customer in the database. This table contains all relevant customer data points, such as historical activity data, original acquisition channel, demographic data, and other available data points.
The single customer view is updated on a daily basis, allowing us to track the changes in customer behavior in a very granular way.
Here’s an example of what a single customer view looks like:
Based on the single customer view, Optimove creates the Customer Model.
The three levels of the customer segmentation
The model is built in a layered structure – starting from high-level segmentation, and then breaking down each one of the segments to more granular micro-segments.
These are the three levels of our Scientific Micro-Segmentation:
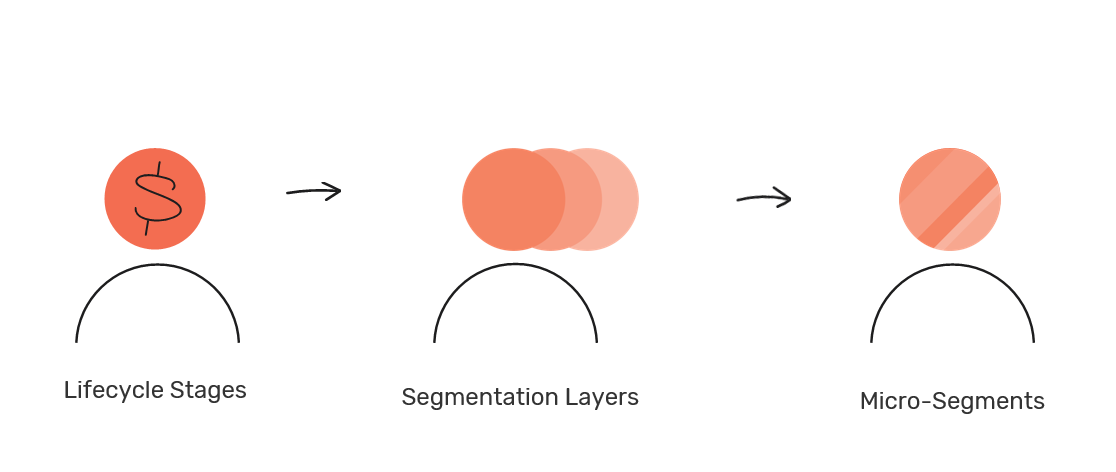
Level 1: Lifecycle Stages
In level one, we get an initial level of clarity about your customers by segmenting them into Lifecycle stages.
Customer lifecycle stages serve as the foundation of Optimove’s micro-segmentation and predictive analytics. They determine the objective of the marketing activities targeted at customers, provide you with knowledge regarding the relationship phase of each customer with your brand, and allow us to monitor movements between relationship phases. To put simply, if a client moves from the New lifecycle to the Active lifecycle and then to the Churn lifecycle, Optimove will be able to track these movements.
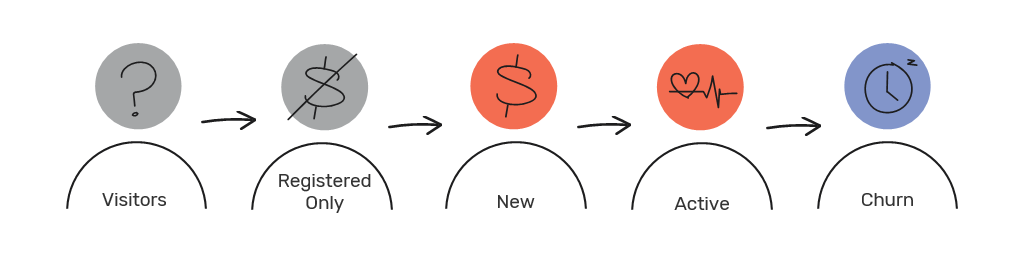
Extensive business benefits can be gained by looking at lifecycle stage migrations, which provide a clear indication of churn rates, reactivation rates, and other migration patterns among lifecycle stage groups.
Level 2: Segmentation Layers
At this level, Optimove identifies significant customer attributes, and every lifecycle stage is broken down into “Segmentation Layers.” This provides deeper insight into the lifecycle stage segmentation.
Optimove dives deeper and segments customers in each lifecycle stage group into distinct segmentation “layers.”
This segmentation is achieved using cluster analysis on sets of attributes that share a common context. Some segmentation layers are behavioral, while others might be demographic in nature.
The image below is an example of the layers for the second level of segmentation:
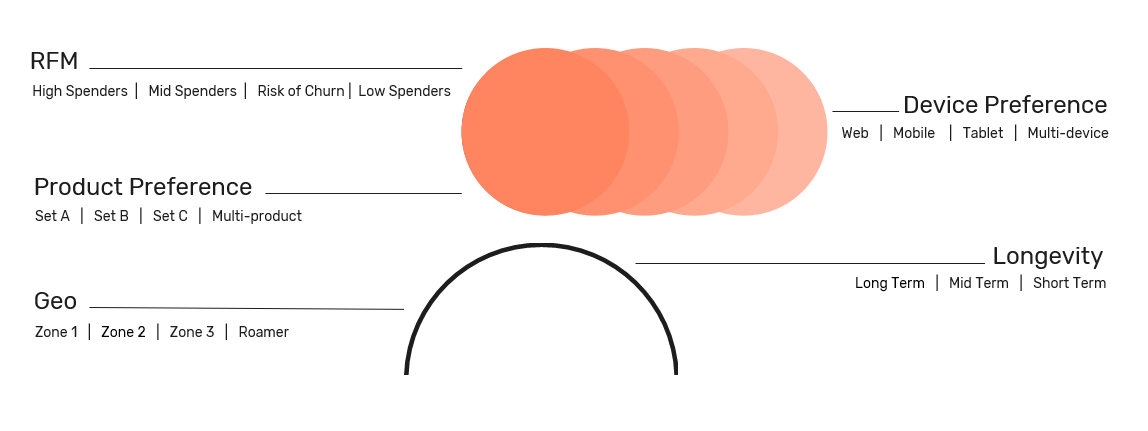
An example of an RFM Segmentation Layer
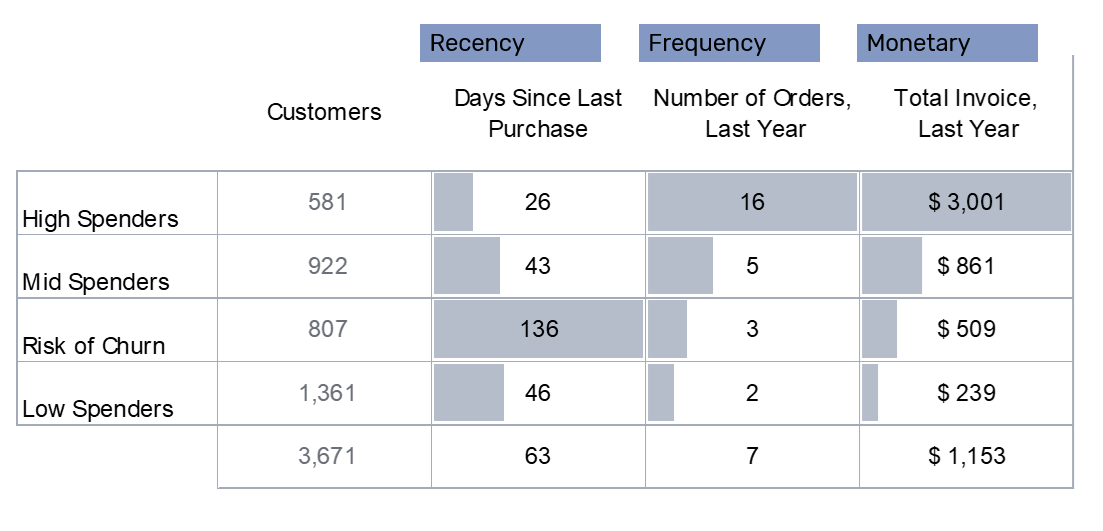
These distinct customer personas allow marketers to personalize marketing efforts for much greater effectiveness.
An example of a Product Preferences Segmentation Layer
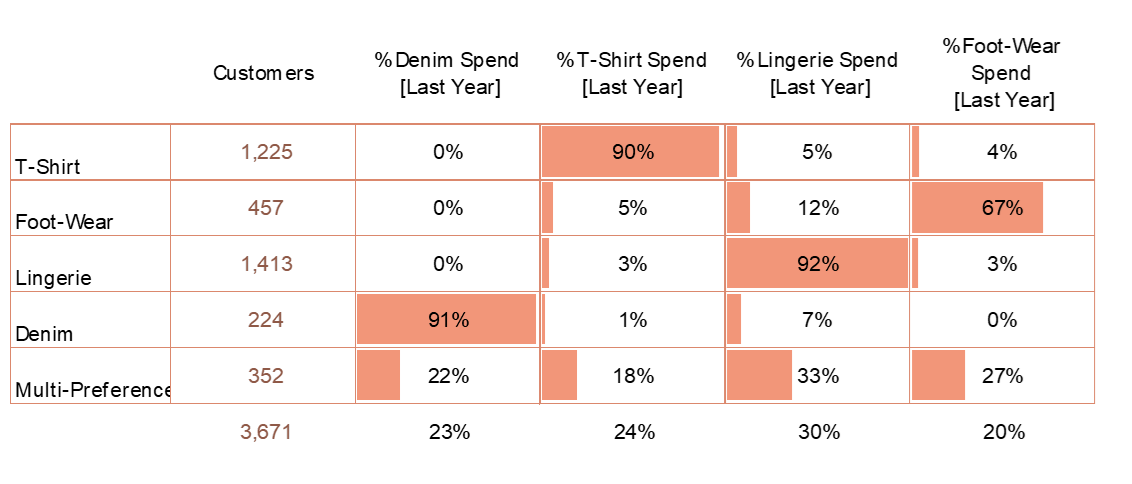
Level 3: Micro-Segments
The last level is dedicated to discovering distinct customer personas. After completing the initial lifecycle stage and layer segmentation, Optimove places customers into one or more relevant clusters within each segmentation layer.
Each customer will then be associated with a string of different clusters. Customers with the same pattern of cluster associations are then grouped together as a micro-segment.
To achieve the highest level of granularity, Optimove clusters customers into behavior-based micro-segments, revealing distinct customer personas. These small, homogenous customer groups are essential building blocks for achieving hyper-personalized customer marketing.
The image below is an example of a persona that was identified as:
- A high spender
- Uses multiple devices
- Has a specific product preference (“Set B”, in this case)
- Located in Zone 2
- Is a long-term customer
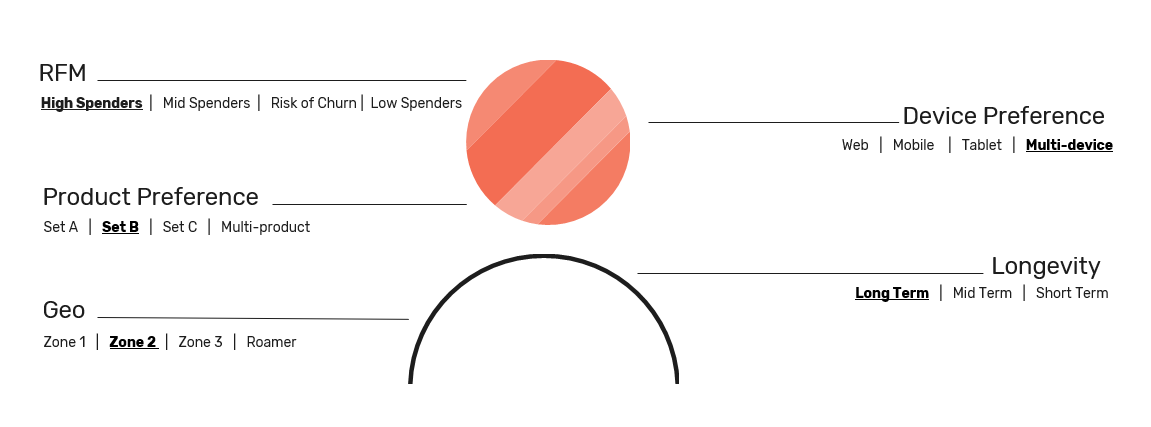
Each customer persona has a unique “DNA” – the specific combination of attributes in each segmentation layer, per lifecycle stage. Customers with identical “DNA” form a micro-segment.
Predictive Customer Analytics
Optimove tracks and analyzes the micro-segment migrations to accurately predict:
- Customer Future Value
- Churn Likelihood
- Conversion Likelihood
- Reactivation likelihood
The predictive approach combines LTV forecasting, continual dynamic micro-segmentation, and a unique, mathematically-intensive predictive behavior modeling system.
This advanced customer modeling technology serves as the brain behind a powerful retention automation system, which makes it easy to plan and execute successful marketing campaigns to existing customers.