
Customer segmentation is the practice of dividing a company’s customers into groups based on common attributes. Segmentation plays a large role in a business’s ability to maximize the value of each customer, either through analysis or by tailoring segment-specific, personalized messages.
Optimove segment customers using a combination of rule-based segmentation and a mathematical algorithm known as “k-means clustering,” to segment customers into groups based on predictions regarding their total future value to the company.
This segmentation is available to you in Optimove’s Customer Model as Segmentation Layers and their respective clusters. To target your customers, you can build any segment either by using the layers and clusters as a base or by adding customer attributes.
Below, we will discuss Optimove’s segmentation methods.
What is Rule-Based Segmentation
This is the most common segmentation practice and the easiest to perform. Using Rule-Based Segmentation, marketers segment customers based on heuristics such as the customers’ industry, age, number of purchases, etc.
While Rule-Based Segmentation is useful in some scenarios, it has several disadvantages over more advanced segmentation methods:
- Rule-Based Segmentation is static by nature and doesn’t account for changes in customer behavior. Setting a fixed threshold for a segment is not an ideal way to deal with customer segments. For example, customers that spend over $500 may be considered VIPs today, but as your business evolves, the threshold may increase, and you will have to manually adjust the segment.
- It relies on human logic and segments are often built according to “common sense”, rather than using machine learning or algorithms to find patterns and similarities.
- Creating highly complex segments that have several segmentation layers becomes extremely difficult fairly quickly.
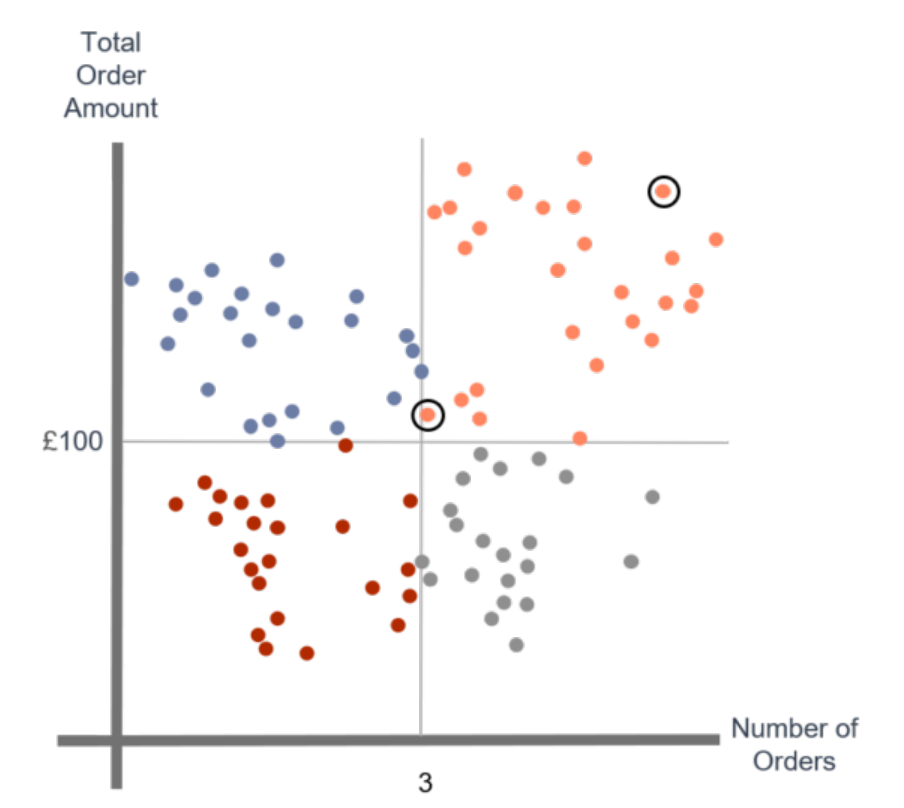
The below example illustrates Rule-Based Segmentation and why this approach is not ideal.
The customers in the chart are segmented based on two rules:
- Their number of orders (the X-axis)
- Their total order amount (the Y-axis)
Note the two highlighted customers – even though their purchase patterns are significantly different, they were both included in the same (orange) segment.
What is Cluster Analysis
Cluster analysis uses a mathematical model to discover groups of similar customers based on the smallest variations among customers. These homogeneous groups are known as “personas.”
The process is not based on any predetermined thresholds or rules. Rather, the data itself generates the customer prototypes that exist within the population of customers.
The resulting clusters are used to target customers with offers and incentives personalized to their wants, needs, and preferences.
As customer segments are dynamic, and user preferences can change daily, Cluster Analysis allows for more data agility and flexibility than Rule-Based Segmentation:
- The clusters are formed directly from the data itself rather than relying on business rules or filtering.
- Due to its direct nature, K-means clustering picks up on changes in clustering over time, and depending on the data availability, it can deliver real-time or near-real-time customer segmentation.
- Since performed using algorithms in the database, no human interaction is required.
Using the same data as shown before for Rule-Based Segmentation, in the graph below Cluster Analysis identifies five distinct customer groups instead of only four. The dots represent customers split into several personas, where each persona is labeled with a different color – blue, light blue, orange, red, and gray.
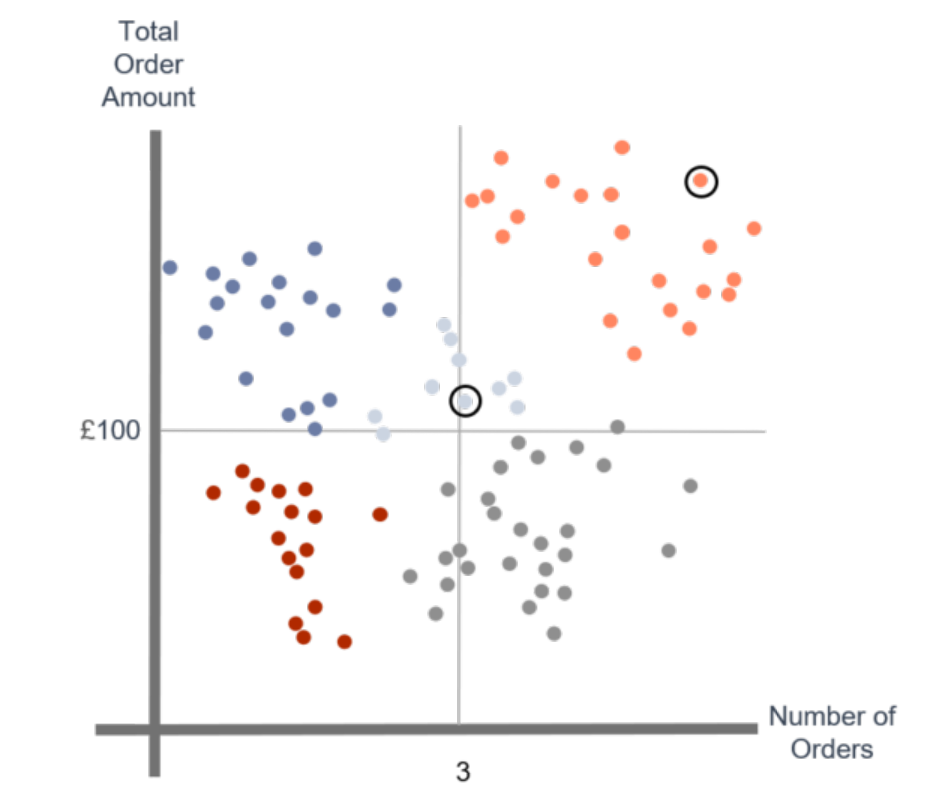
Example of Cluster Analysis Results
This chart shows the results of a seven-dimension cluster analysis, which led to the discovery of 7 customer prototypes.

Once you have a clear view of the various customer personas, it makes sense to target each persona with the marketing campaigns most relevant to their product preferences.
The Optimove Segmentation Approach
Most companies view segmentation as a method of clustering similar customers together at a given point in time, completely disregarding the route that each customer has taken to reach his or her present segment.
Optimove tracks customers’ movements among segments over time, to achieve far more accurate segmentation. Optimove calculates customer lifetime value (LTV) between all of the customers’ movements to segment customers into groups, based on predictions regarding their total future value to the company, with the goal of addressing each group (or individual) in the way most likely to maximize future value.
The hybrid (rule-based and K-means cluster) analysis method, as well as the tracking of movement between segments over time, are at the core of Optimove’s Customer Model.