
Once you’ve got the model’s results, here’s how you can use them to build your target groups right in the UI.
Customer Migrations from One Micro-segment to Another
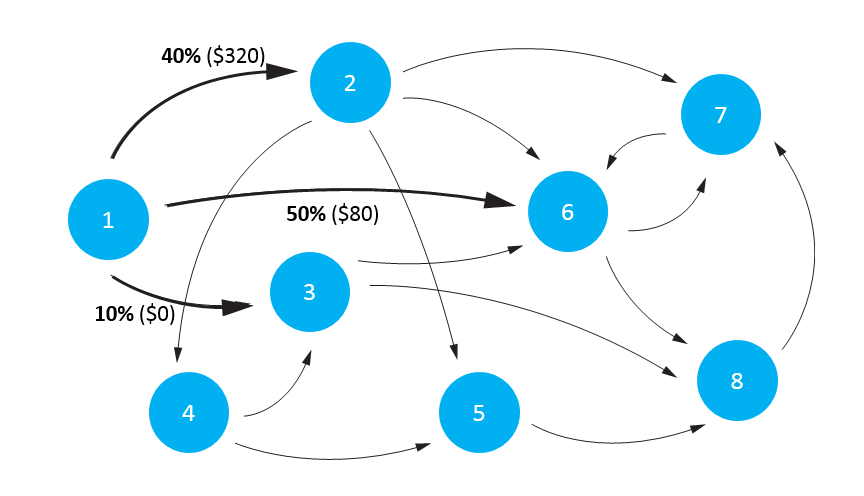
As you probably already know, much of Optimove’s customer modeling is based on the use of customer micro-segments. Micro-segments are small groups of customers sharing very similar behavioral attributes. Optimove is constantly tracking which customers belong to which micro-segments and how they migrate among micro-segments over time. Based on the history of customer migrations within the database, the software can predict the likelihood of customers in one micro-segment moving to a different micro-segment in the next period.
|| Note that the typical customer database contains hundreds of different micro-segments. Customers frequently migrate among these micro-segments based on their recent activities and behaviors.
The Historical Value of Micro-segment Migrations
Optimove also tracks the historical value derived from an average customer migrating from every micro-segment to every other.
|| Note that “value” usually reflects revenues, although other metrics are sometimes preferred (e.g., net gaming, profit, number of transactions).
Calculating Future Value
Now that we understand the two components of the calculation, we can describe how Optimove predicts the future value of customers in each micro-segment. Let’s illustrate this with an example.
Into the Future
- Customer future value and customer lifetime value are two very different metrics. Customer future value is a predicted figure representing the future revenues (or other metric) that the customer is expected to generate from today until the future value calculation horizon. Customer lifetime value is the sum of all revenues actually generated by a customer until today, plus the predicted future value.
- The distance into the future that Optimove calculates future value depends on a number of factors, such as industry, typical customer lifetime, and the Optimove user’s needs. You can see the period in use on the Dashboard page, at the bottom of the Predicted Future Value Trend chart.