
A company’s ability to prevent customers from churning is directly linked to its profitability. Identifying which customers are at risk of churn tells us when we should send win-back offers and encourage return to activity.
In this article, we will review 3 indicators to help you identify customers in risk of churn, and provide some ideas for win-back campaigns.
Risk of Churn Indicators in Optimove
RFM Segmentation
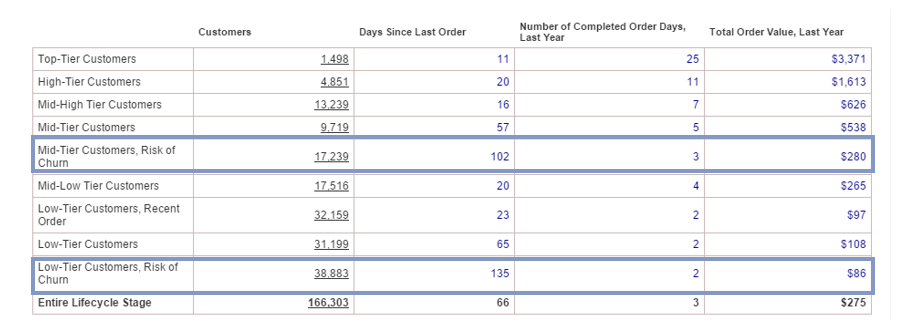
Optimove uses RFM segmentation to segment users into clusters with similar behavioral patterns. One of the parameters used in RFM segmentation is Recency – that is, the number of days since a customer’s last activity. The “Risk of Churn” segment indicates groups of customers who have not shopped, paid or played for a long time, plus higher and lower value segments.
Churn Likelihood Prediction
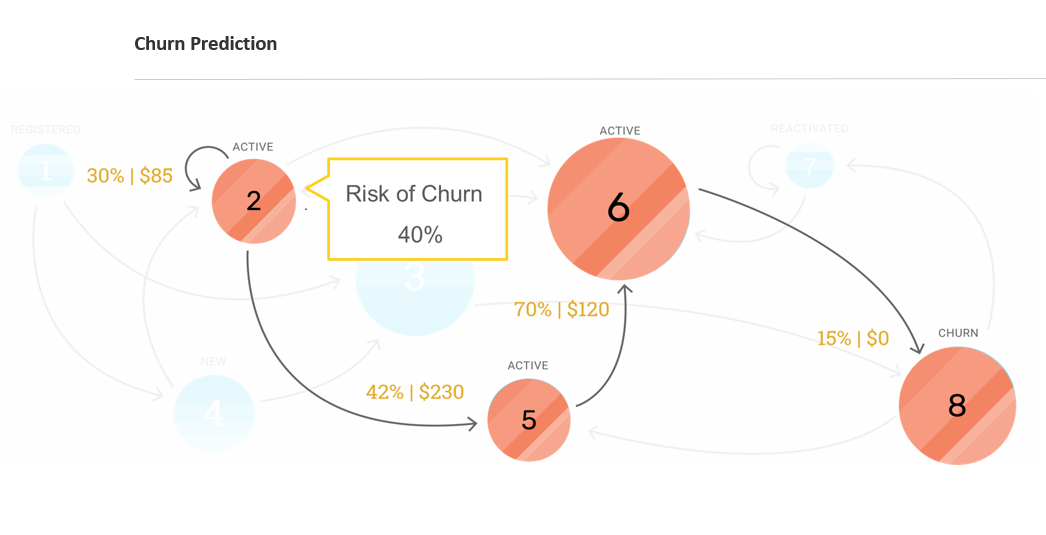
Based on past micro-segment migrations, Optimove predicts the expected likelihood that customers will migrate to churn micro-segments.
Churn Factor
Churn Factor is a criterion that defines customer churn for individual customers, by considering each customer's individual activity frequency.
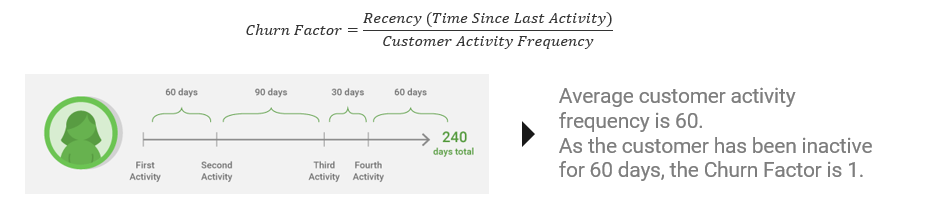
The higher the churn factor, the more likely the customer has already churned, and may not return.
For a given customer, 60 days since activity could indicate churn, and for others, like in the above example, 60 days is within the normal range and should not be flagged as risk of churn.
Churn Factor threshold is typically set between 2 and 3. In other words, a customer will be
considered in risk of churn once double or triple the customer’s typical length of time between activities has elapsed.
considered in risk of churn once double or triple the customer’s typical length of time between activities has elapsed.
In some verticals, 3 times beyond expected activity may only be a few days, while in others it may be 6 months. As the frequency is higher, the churn factor threshold should be higher.
Which indicator should you use in your target groups?
A combination of these methods will provide the best result: Churn Factor + Churn Rate Prediction is the right approach.
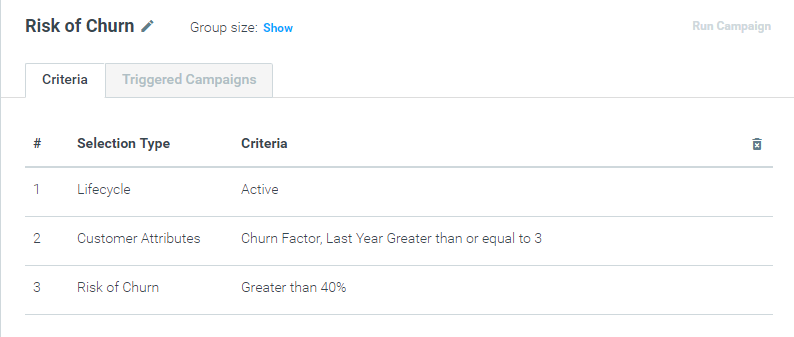
Risk of churn prediction and the RFM “Risk of Churn” segments are highly correlated. Therefore, it is unnecessary to include both.
Win-back campaign examples
- Free offer (promotional gift, free spins, free bonus) to encourage engagement
- Offer a high incentive in return for a real transaction.
- Split the group into High, Mid and Low tiers and differentiate the offers.
- Identify issues around customer experience (repeated returns, multiple losses, etc.) and communicate accordingly.
- Use follow-up campaigns and reminders on top of the above to avoid missing out on opportunities.
- Use multi-channel campaigns to maximize the chances of interacting with the customer.