Web Push Notifications
Target your customers with web-push notifications
To enhance your multi-channel communications, our Web SDK now has the added capability of executing web-push notifications on desktop and mobile.
As part of our OptiMobile package, you can now deliver real-time web push notifications, as well as web pop-ups and Track and Trigger capabilities all from one SDK.
With this new capability, you are even more equipped to execute symmetric messaging across web, mobile, email, and additional channels across customer journeys.
To read more about our Web SDK, click
here.
Calculated Attributes
Dive deeper into your customer attributes with the new If/Else calculation
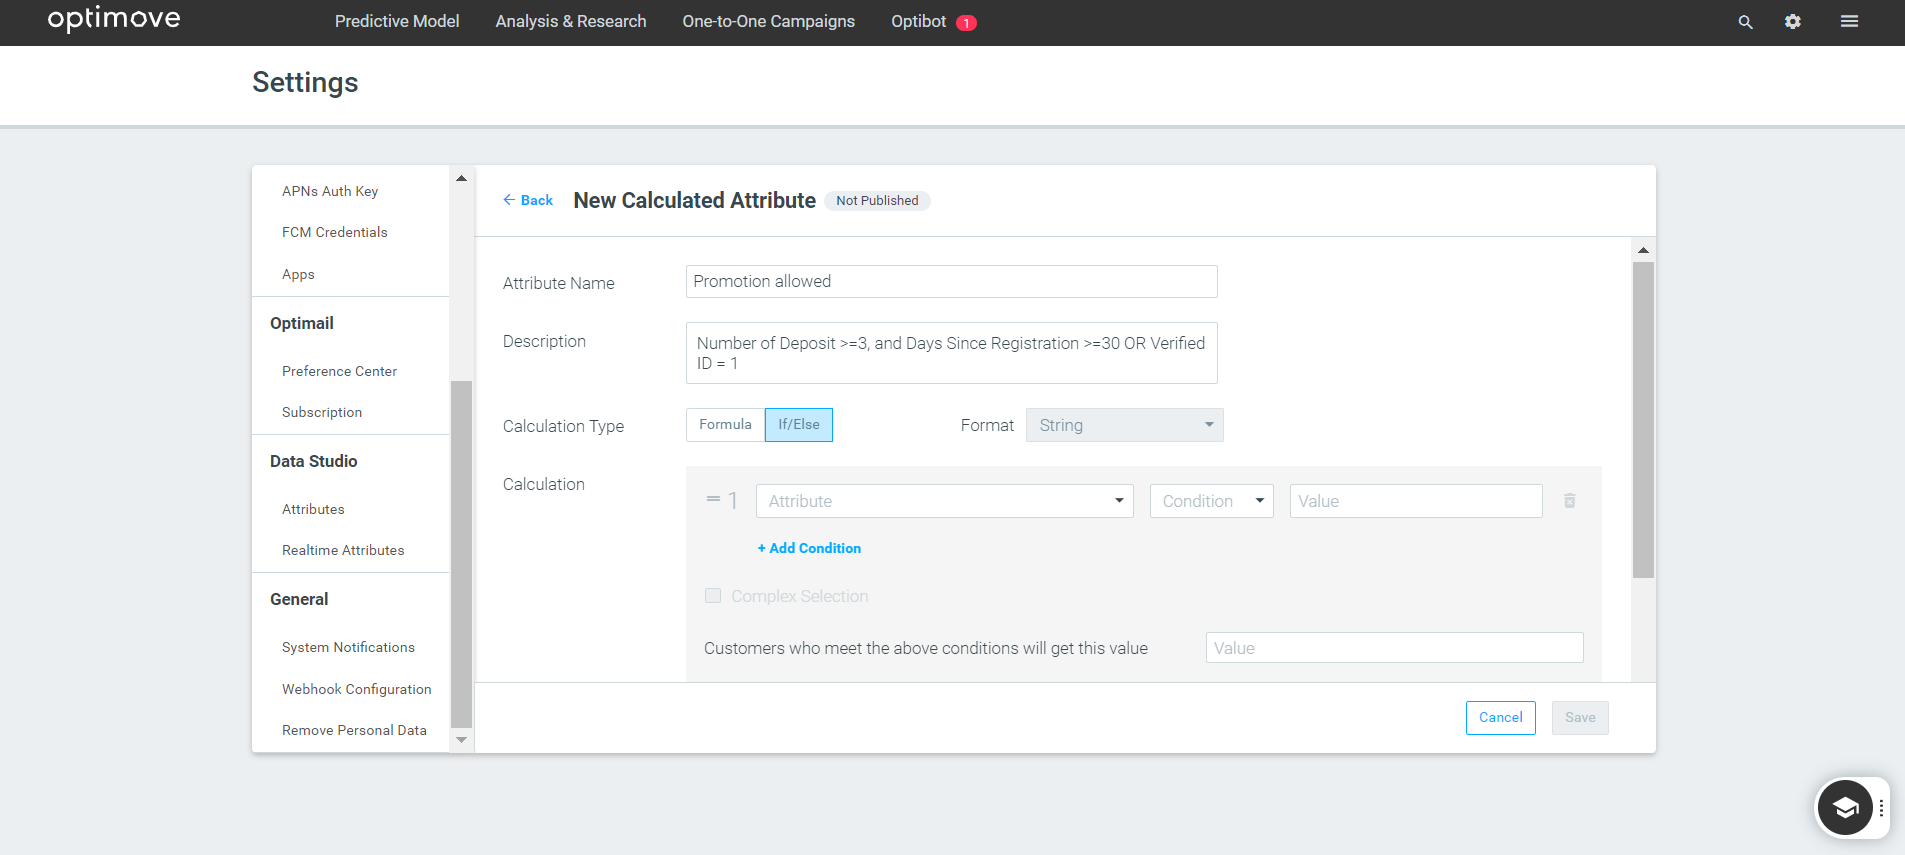
To create more granular target groups, you can combine attributes using a customized formula. This has now been enhanced with the "If/Else" calculation which allows you to specify conditions for the new attributes.
When creating the conditional attribute, the customer will only receive a campaign if certain conditions are met. Each attribute will therefore result in a "yes/no" value based on these conditions.
For example, you can create an attribute based on if the Average Value Order is between 100-500 USD, and it's been over 1 month since the last purchase, then create an attribute of "Promotion Allowed".
Read
here to learn how to create calculated customer attributes.
Customer Explorer
Create and analyze your visitor groups all in one place
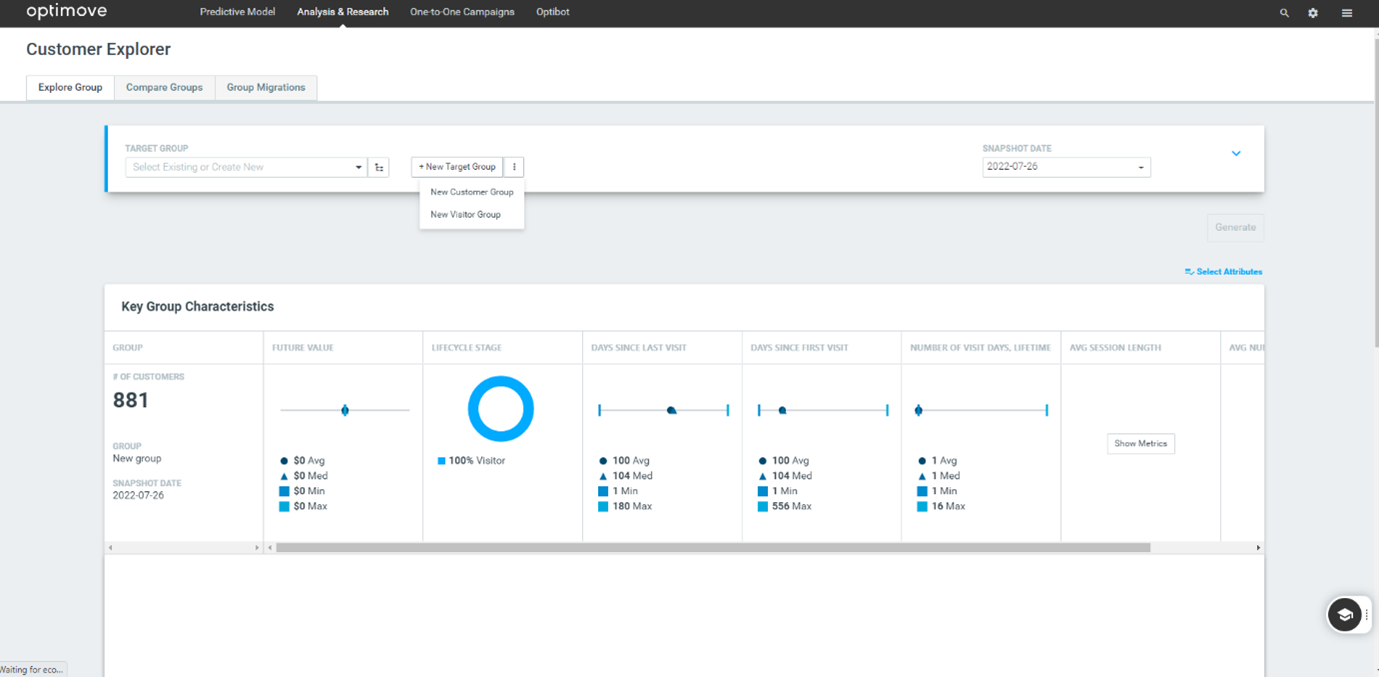
Customer Explorer provides you with key insights into your customers’ characteristics and behavior. With this new enhancement, you can not only explore your customers, but you can dive into your visitor groups too.
Now using Customer Explorer, you can create, save and analyze a visitor group all in one place.
This means you can understand your visitors’ behavior, such as where the visitor was acquired, or their session duration. Leveraging this data on users from the first stage of the conversion funnel will then allow you to optimize your acquisition campaigns to target visitors based on survivability and lifetime value.
Once you have created your visitor group in Customer Explorer, you can save this as a target group and target the visitors in Track and Trigger campaigns.
To get an overview of Customer Explorer, read
here.
Mission Control
Understand your campaign prioritization and exclusion rules
Our prioritization and exclusion mechanism allows you to ensure your customers are receiving the most relevant campaigns. But when you’re running multiple campaigns at once it can be difficult to see whether your prioritization rules are optimizing your business goals.
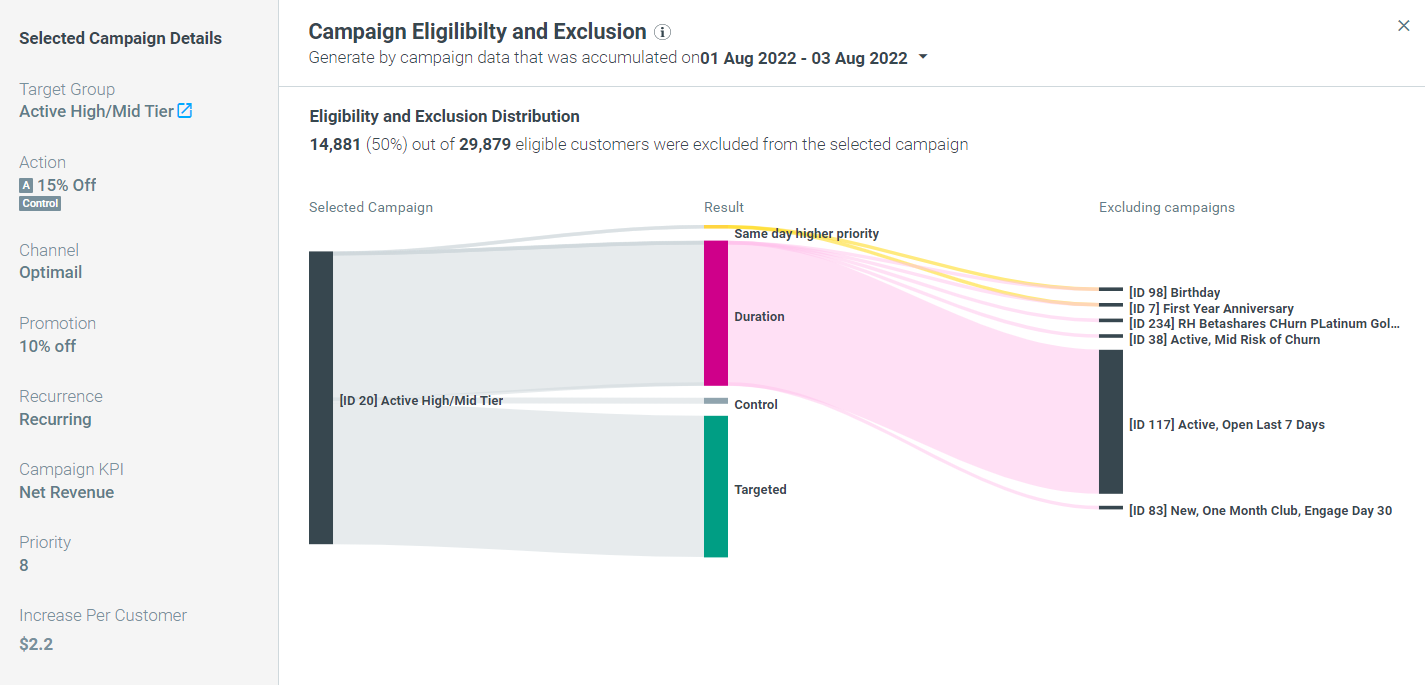
Now, with the Eligibility & Exclusion graph, this mechanism has become visible and actionable. The graph shows how many customers were excluded, why they were excluded, and by which campaign.
By understanding how your prioritization rules are being executed, you can drive business decisions around your campaign orchestration setup. For example, when looking at the graph and seeing how many customers were excluded, you may want to rethink whether you should prioritize a weekend sales campaign over an anniversary campaign.
Additional data points to analyze your campaigns
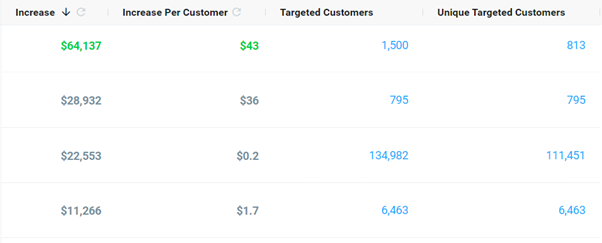
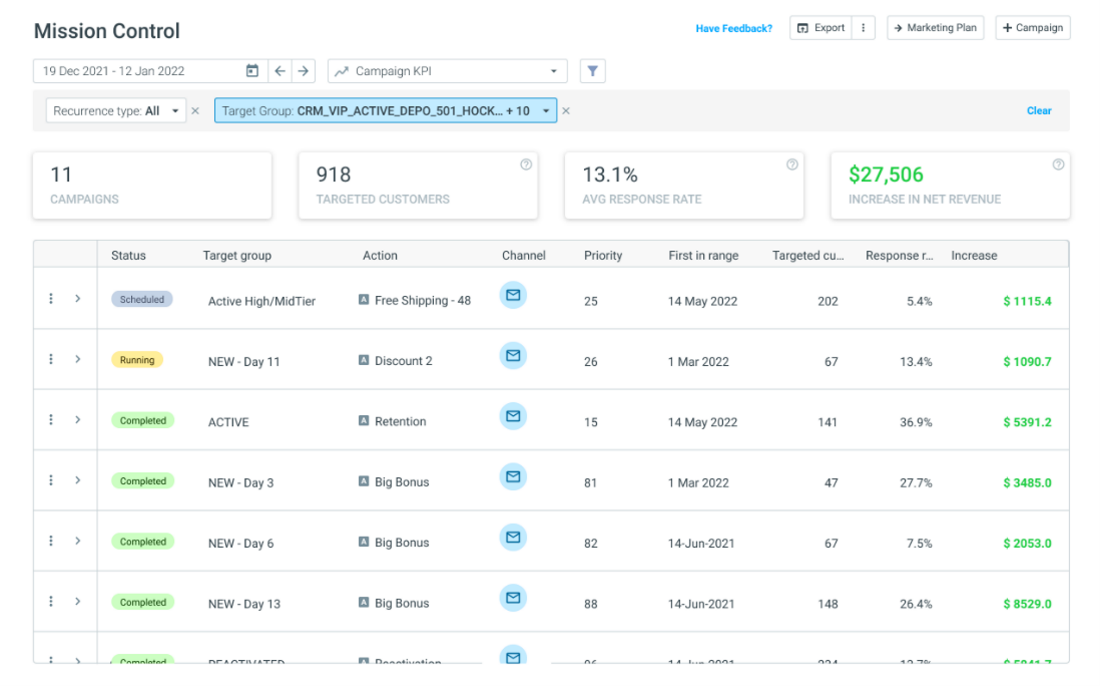
Mission Control now provides you with two new data points to measure the effectiveness of your campaigns.
Unique Targeted Customers shows the number of distinct customers that were targeted by a recurring campaign. This means if one customer received the same campaign 5 times across the reporting period, it will be counted as 1 Unique Targeted Customer.
Optimove measures the value a campaign increased any chosen KPI, such as purchase amount or net revenue. Increase Per Customer provides an average of this value, so you can make comparisons between campaigns with different-sized target groups.
Export Occurrences for your data needs
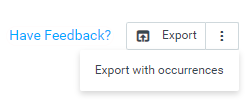
You can now export all occurrence data of your campaign series, rather than only summarized data. With this improvement, you can perform advanced analysis using Optimove data combined with other data sources.
“Show Increase” to all rows in one click
You can now measure the success of all your campaigns with ease. Using the “Show Increase” button, the data for every campaign will now show at once, rather than having to do this for each individual campaign.
Read
here to take advantage of all data points provided in Mission Control.
Cohorts Renewed Report
Track and compare the quality of your cohorts over time
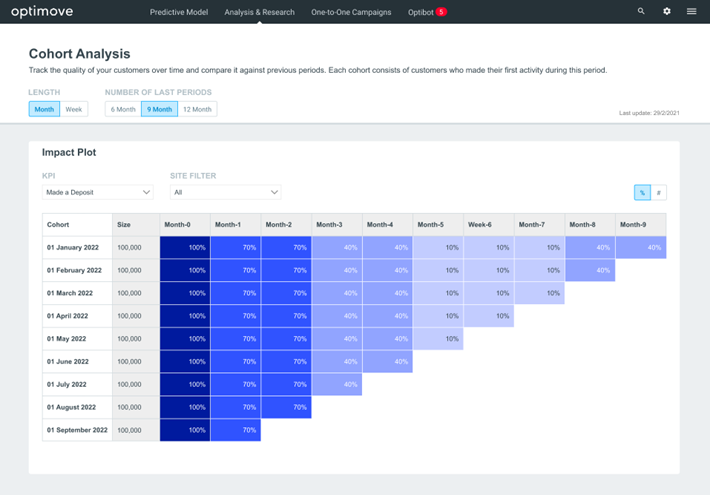
Our new Cohort Analysis Report allows you to analyze the behavior of groups of customers from the point of acquisition. This provides you with insight into how customers interact with your business during their early lifecycle stages to help you optimize acquisition strategies and retain active customers.
The report can be analyzed in three ways
1. Horizontally: gain insights on how each cohort behaves on a weekly/monthly basis
2. Vertically: compare how different cohorts behave in each respective month of their lifecycle stage
3. Diagonally: understand how each cohort behaves on the same calendar week/month